The graph below shows population figures for India and China since the year 2000 and predicted population growth up until 2050.
Summarise the information by selecting and reporting the main features, and make comparisons where relevant.
Write at least 150 words.
Model answer
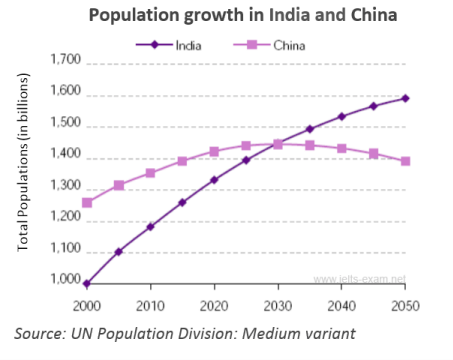
The graph shows how the populations of India and China have changed since 2000 and how they will change in the future.
In 2000, there were more people living in China than in India. The number of Chinese was 1.25 billion, while India's population was about 1 billion. Between 2000 and the present, there has been a 0.2 billion rise in the number of Indian citizens. Over the same period, China's population has increased by 0.1 billion to reach over 1.35 billion.
According to the graph, the population in India will increase more quickly than in China, and experts say that by 2030, both countries will have the same population of 1.45 billion. After this, China's population is likely to fall slightly to 1.4 billion in 2050, while India's population will probably increase and reach 1.6 billion.
Thus, over the 50-year period, India is going to experience steady growth in its population and it will overtake China. On the other hand, China's population will peak in 2030 and then begin to fall.
(173 words)